
Patreon Benefits Explained
The DataDrivenHockey Patreon provides enhanced access to the data, rankings, and model outputs featured on social media. Patreon is a platform that allows creators like me to offer exclusive content to their supporters, who subscribe for a monthly fee. By becoming a patron, you directly support my work and gain access to special perks.
The Patreon tiers (levels of membership) are listed in the table of benefits below. Each subsequent tier includes all benefits included in the previous tiers. Click a tier to jump to that section, or click a specific tool/perk to jump to its description and instructions.
Table of Benefits
Access the Benefits
Expected Goal Scorer Tier
10 USD/month
All the benefits included in this tier are available on the DataDrivenHockey website or in the Expected Goal Scorer Perks Google Drive folder. Access to the folder is gained via the pinned post on Patreon (see the *Access the Benefits* section above).
Daily NHL Game and Player Prop Probabilities
Daily NHL game probabilities from GPM2, updated every 3 hours to include the latest lineup and starting goalie information available.
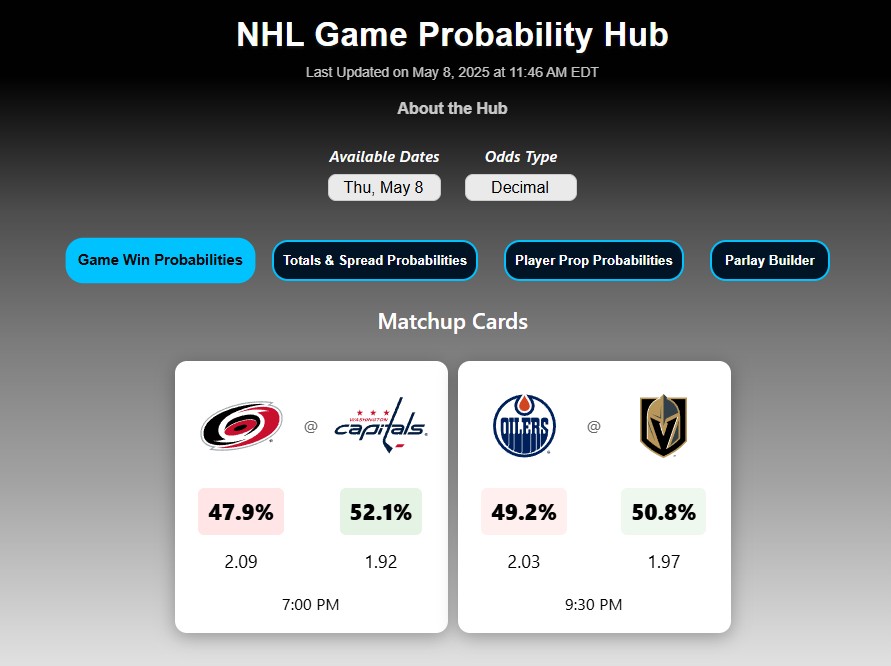
Daily probabilities included in the hub:
- Game win probabilities
- Skater prop probabilities for goals, assists, points, shots and blocks
- Regulation win probabilities
- Overtime/Shootout win probabilities
- Total and individual team goal probabilities
- Puck line probabilities
- Total and individual team shot probabilities
…and the Parlay Builder!
The parlay builder allows you to calculate same-game parlay probabilities using the GPM2 probability projections. The parlay probability calculated by the parlay builder accounts for the statistical dependence of events that occur in an NHL game, so it is not the same as the probability of multiplying two individual ‘leg’ probabilities together. The image below shows a small same-game parlay that illustrates this concept.
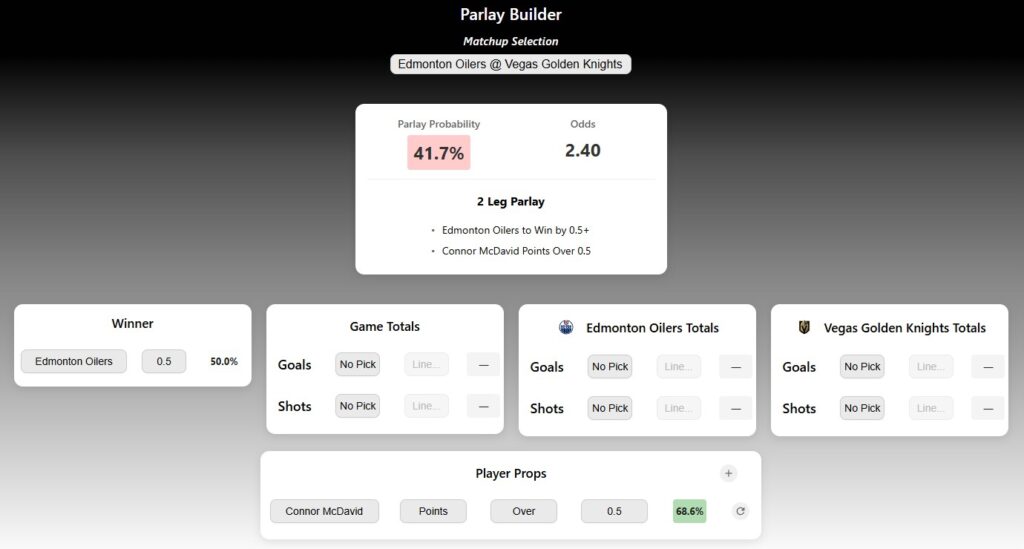
The probability for a single leg of the parlay hitting is displayed on the far right of the individual leg entry. Multiplying 50% (Edmonton’s win probability) by 68.6% (McDavid’s point probability) yields a probability of 34%. However, the parlay builder has calculated a probability of 41.7% because these events are not independent → McDavid producing offense impacts the probability that Edmonton will win.
You can calculate multi-game parlay probabilities by multiplying the probabilities of multiple same-game parlays, because individual games are statistically independent.
Here are the steps for building a parlay…
- Select which game you want to build a parlay for in the Matchup Selection drop-down field.
- Select a potential winner in the Winner section. You will have the option to select “No Pick” if you don’t want to include a game winner pick in the parlay.
- In the Game Totals and Team_Name Totals sections you specify lines and over/unders for goals and shots. These sections have 2 fields; in the first field you specify the type of prop bet by choosing “Over”, “Under” or “No Pick” and in the second field you specify the number that you want the stat (goals or shots) to be over or under.
- In the Player Props section, you begin by searching for a player and stat type in the respective dropdowns. The next steps are the same as the previous section, specify the type (“Over”, “Under” or “No Pick”) and then the actual number that you want the stat to be over or under. You can add more players by clicking the (+) symbol.
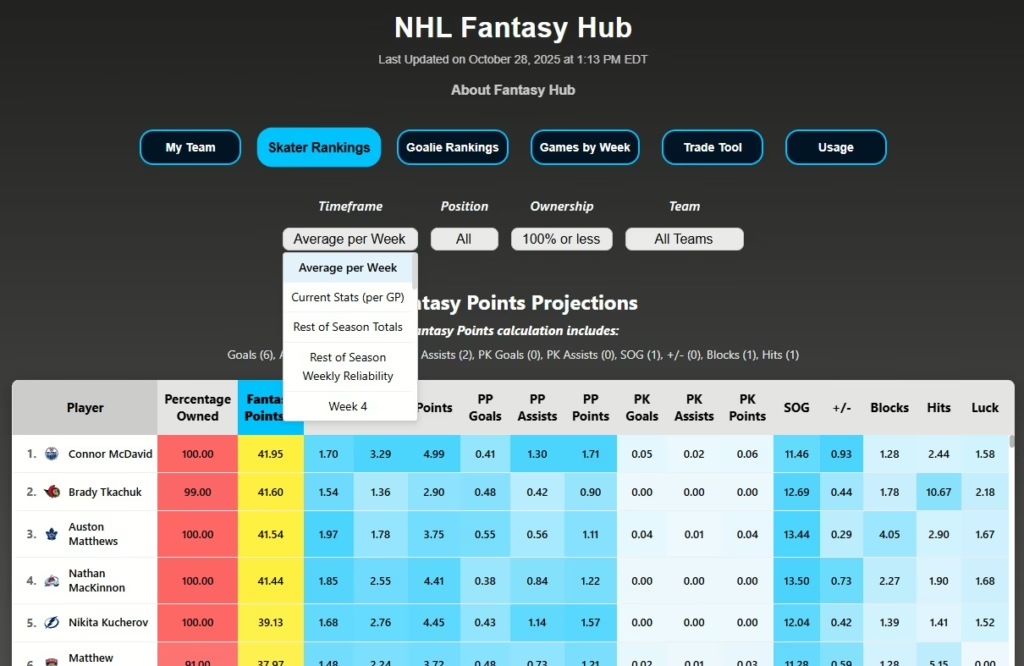
Fantasy Hub
The Fantasy Hub contains multiple tools for fantasy hockey success. Its is updated with the latest available data every morning.
Comprehensive Projections
Week-by-week and rest-of-season data-driven projections for over 600 NHL skaters and 65+ goalies across 14+ categories, including goals, assists, points, shots on goal, hits, blocks, plus/minus, powerplay goals, powerplay assists, power-play points, power-play shots on goal, penalty kill goals, penalty kill assists, and penalty kill points.
Streamline your waiver-wire search with filtering capabilities based on position percentage owned and team. Sort by any of the 14 categories to uncover hidden gems that align with your team’s needs.
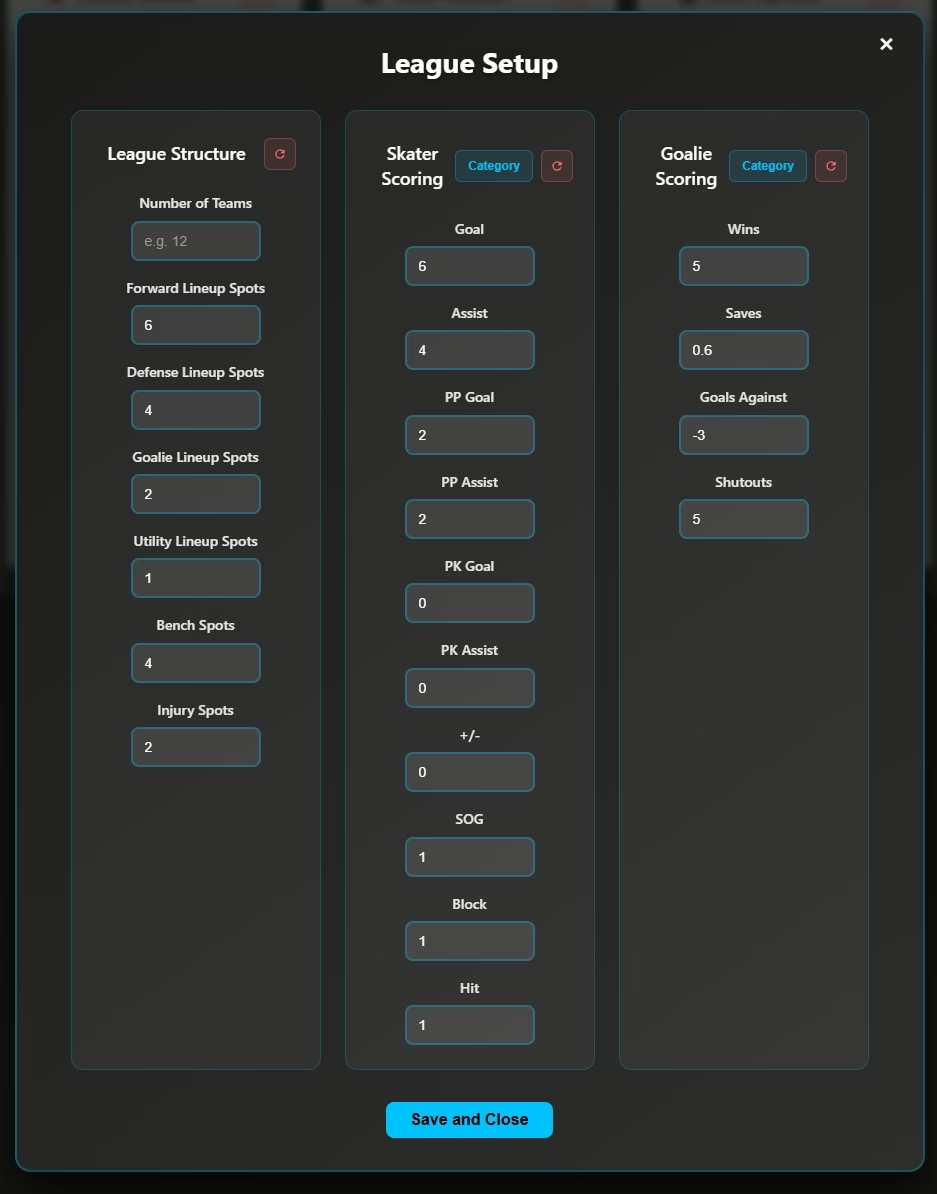
Customization For Your League
Tailor the hub to your league’s settings by customizing fantasy point calculations to match your league’s scoring system.
Trade Analyzer – under development
Evaluate potential trades and assess their impact on your team’s performance before making crucial decisions.
Roster Comparison Feature – under development
Gauge the strength of your roster against opponents by inputting both rosters into the comparison tool. Analyze results across all 14 stat categories and overall fantasy points, giving you a strategic edge for every week’s matchup.
Season Hub – Playoff Probabilities and Stats
This page has 3 sections: Standings/Playoff Projections, NHL Team Cards, and Team Stat Rankings. Both of these sheets are updated early every morning with the latest model outputs and data.
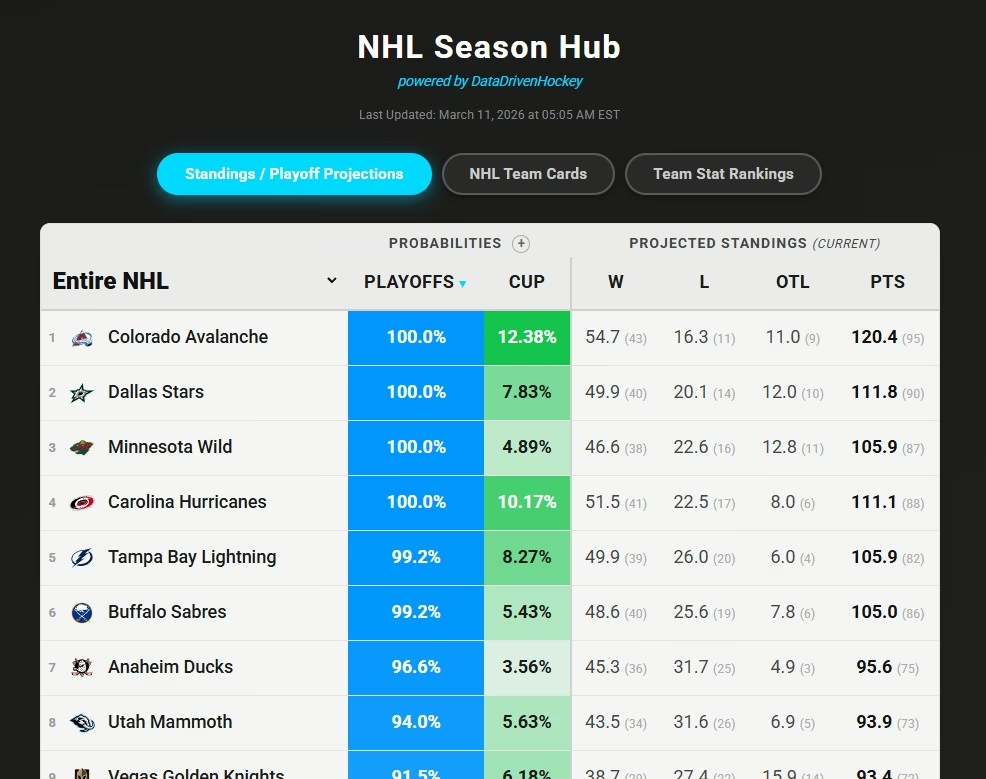
Standings/Playoff Projections
This section contains playoff/cup probabilities and projected standings. The data can be filtered by conference and division and sorted by any of the probabilities and projections.
NHL Team Cards
This section allows you to view two different cards for each NHL team:
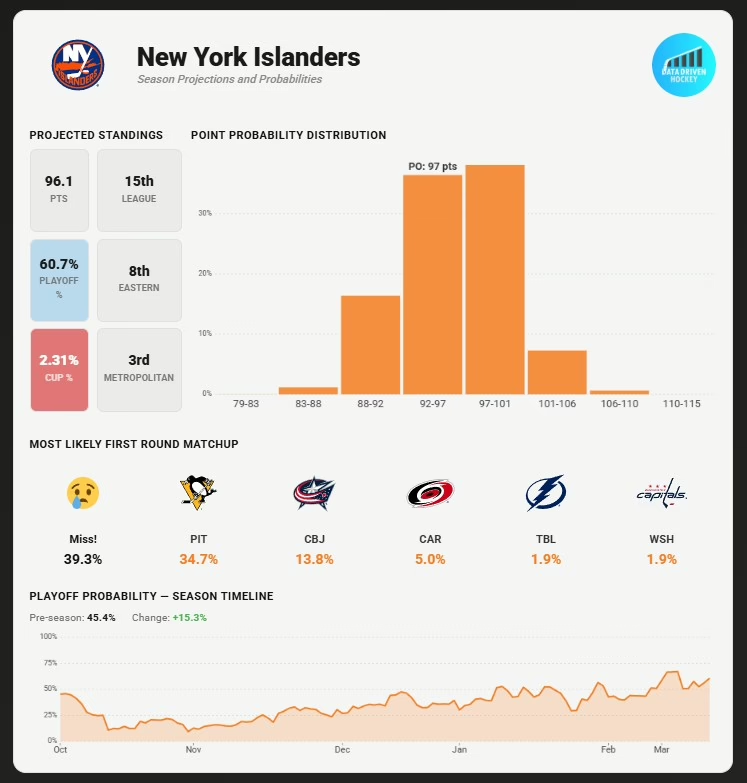
- Season Projections and Probabilities Card. This card summarizes the teams projected outlook for the season. This includes their playoff and cup odds, projected standings points and most likely finishing ranks in their division, conference and the entire NHL. They also show their 6 most likely first round playoff opponents and a full look at how their playoff odds have evolved over the course of the season.
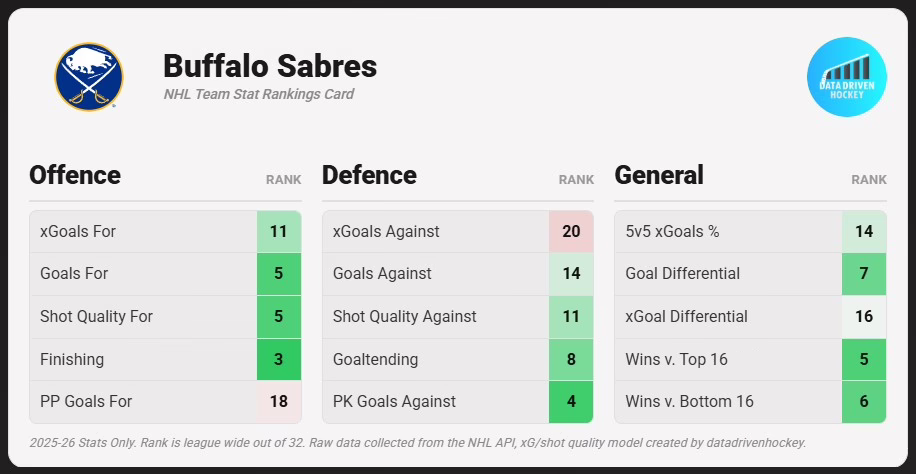
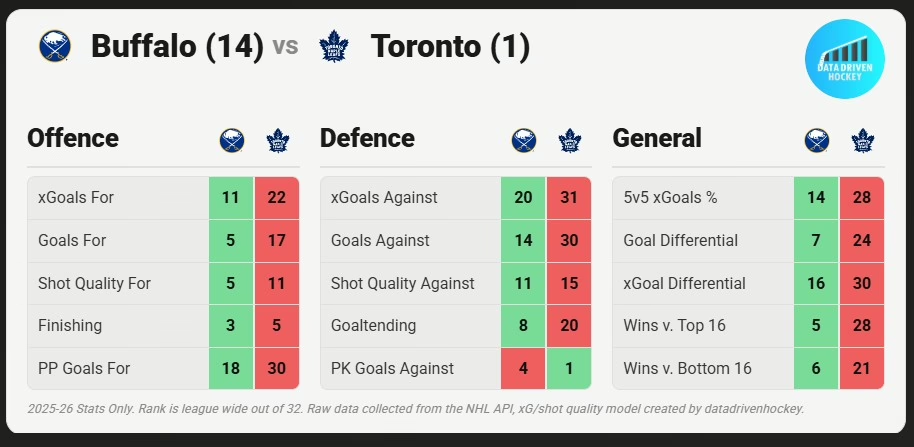
- Season Statistics Cards. This card breaks down where the team ranks in 15 key statistics in the current season. It also allows you to select a second team and compare their rankings. See the image below for an example.
Team Stat Rankings
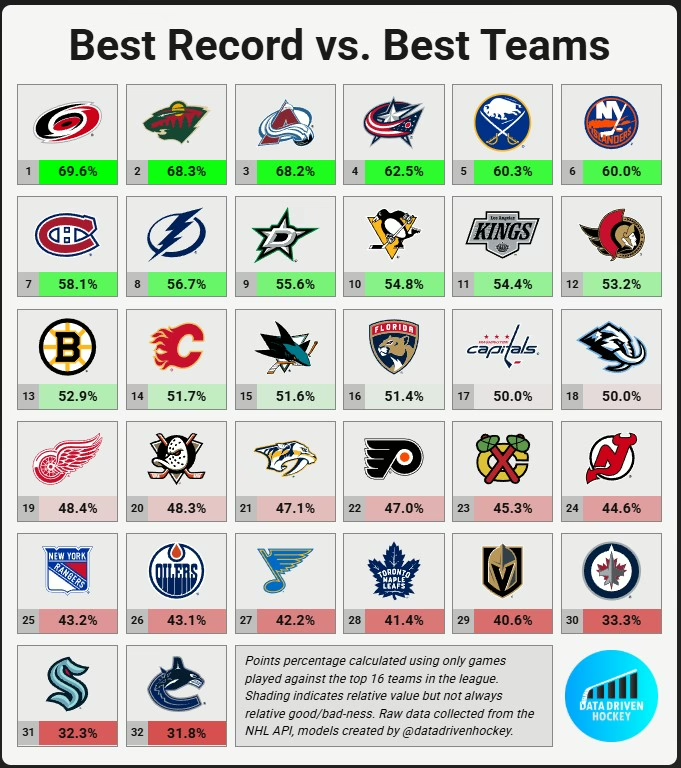
This section allows you to see how NHL Teams stack up against each other in over 100 different stats. Examples of stats: xGF%, Win Percentage vs. Best/Worst Teams, Net Miss Percentage, xGoals per game played, Shot Quality, PDO, etc.
Player Skill Evaluations: Goals Over Average (GOA)
There are 3 different types of player GOA cards available:
- Skater Projection Cards – consider multiple years (a rolling 3-year window) of historical data to provide a forward-looking glimpse into a player’s potential impact
- In-Season Skater Cards – capture the immediacy of a player’s current performance by relying solely on data from the ongoing season
- Historical Skater Cards – In-Season Cards for all NHL forwards and defensemen dating back to the 2011-12 season
The below sections give some background on the GOA model behind the cards and describe how to read the cards.
Skater GOA
GOA is a metric designed to measure and project the goals per 60 differentials of NHL skaters. GOA evaluates a skater’s proficiency in the five most important areas of the game: even-strength offense, even-strength defense, powerplay offense, penalty kill defense, and penalty differentials. A skater’s total GOA is a weighted sum of their skills in these areas. GOA offers a comprehensive view of a skater’s contribution to their team through a nuanced data-driven evaluation that surpasses traditional metrics.
Reading the Skater Cards
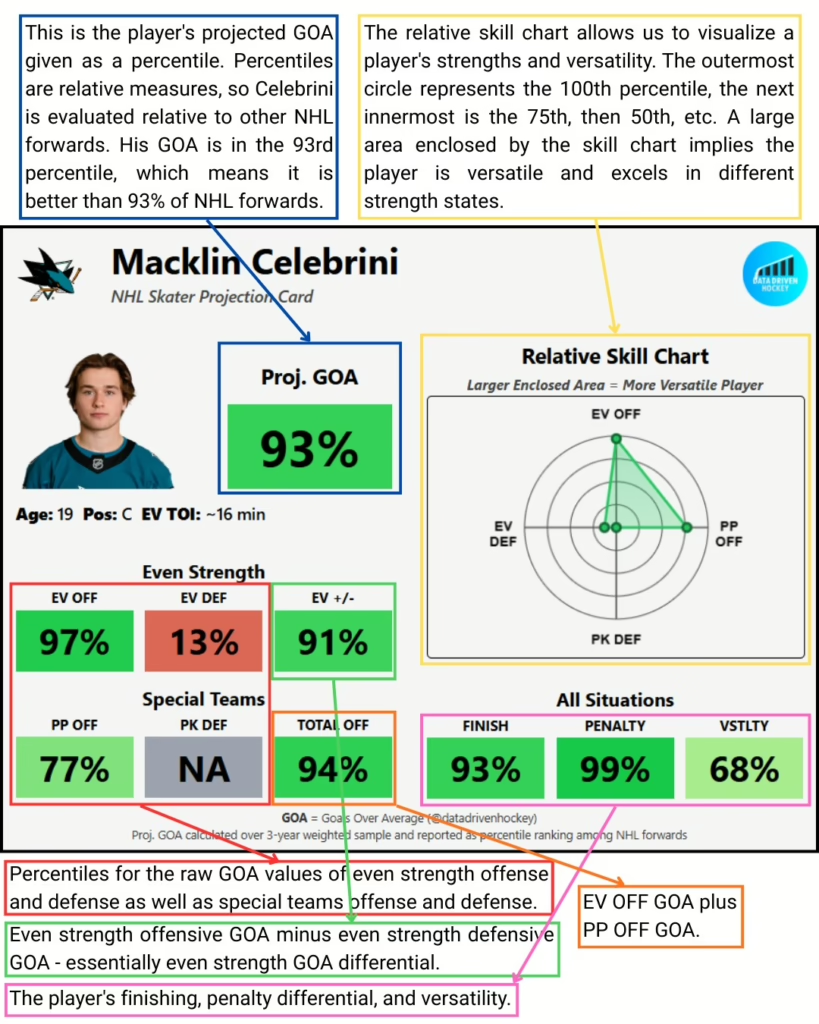
Percentiles Explained
Percentiles are relative measures. On the player skill cards players are evaluated relative to other players at their position. Higher percentile rank means better performance. For instance, a player in the 90th percentile is performing better than 90% of others in the same category. For example, if Slavin is in the 99th percentile for even strength defense, this means he is better at even strength defense than 99% of the other players in the dataset (NHL defensemen).
Versatility Explained
The Versatility Score is a unique metric designed to encapsulate a player’s multifaceted skills on the ice. By summing the percentile ranks across four key categories—Even Strength Offense, Even Strength Defense, Penalty Kill Defense, and Power Play Offense—the Versatility Score provides a holistic view of a player’s capabilities in both offensive and defensive situations. A higher Versatility Score indicates a player who excels both offensively and defensively across a range of strength states. This metric offers a nuanced understanding of a player’s well-rounded impact on the game and provides insights into the diverse strengths that players bring to the ice.
Player Production Projections
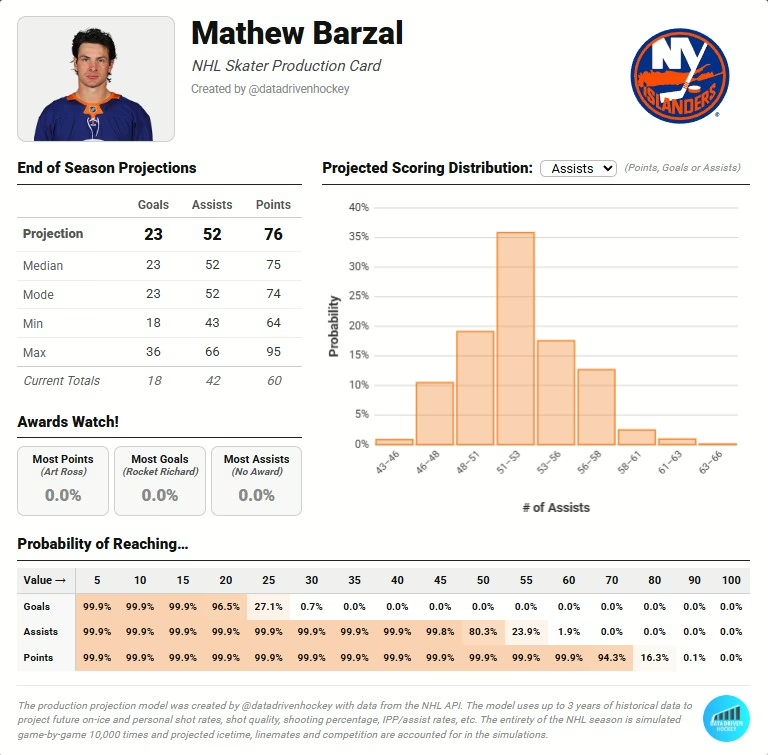
This page contains full-season production projections (i.e., projected number of goals, assists and points) for all NHL skaters. The production projection model uses up to 3 years of historical data to project future on-ice and personal shot rates, shot quality, shooting percentage, IPP/assist rates, etc. The entirety of the NHL season is simulated game-by-game 10,000 times and projected ice time, linemates and competition are accounted for in the simulations.
There are 2 tabs on this page:
- Production Cards. This tab contains cards where you can select any NHL skater and see a breakdown of how they are expected to produce this season. The breakdown includes:
- Their most likely, maximum and minimum goal, assist and point totals
- Their probabilities of winning the Art Ross and Rocket Richard trophies
- Histograms of their projected point, goal and assist totals
- Their probabilities of hitting goal, assist and point milestones
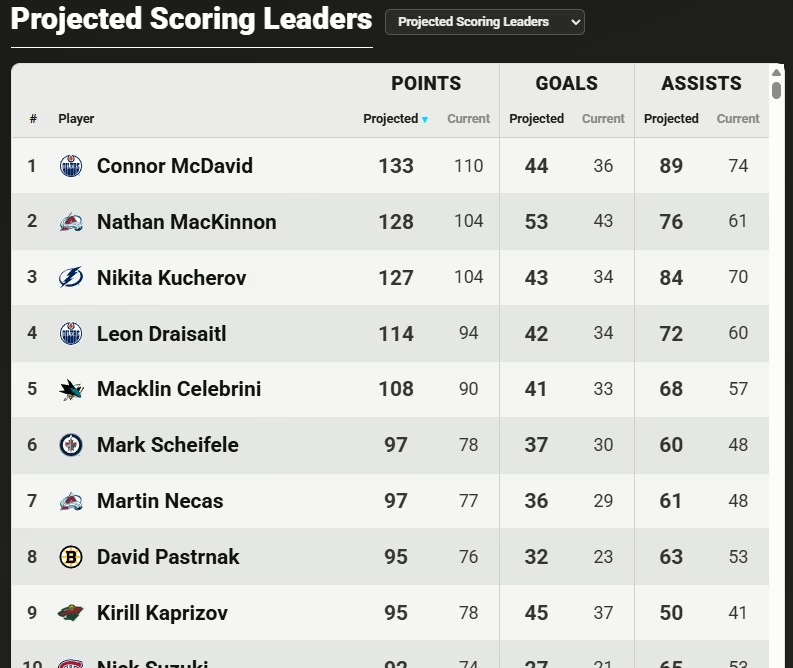
- Projected Leaderboards. This tab contains ranked tables of NHL skaters, including:
- Projected Scoring Leaders. All NHL skaters ranked based on their projected end of season point, goal and assist totals. It is sorted by points.
- Rocket Richard Probabilities. NHL skaters ranked by their probability of winning the Rocket Richard trophy.
- Art Ross Probabilities. NHL skaters ranked by their probability of winning the Art Ross trophy.
- Assist Leader Probabilities. NHL skaters ranked by their probability of leading the NHL in assists.
Expected Goal Scorer Elite Tier
20.00 USD/month
Value Vault
The Value Vault tool sifts through the daily NHL lines and reports the lines with an edge according to the model (GPM2). While the same model that is available in the less expensive tiers is used for the probabilities, the benefit of the Value Vault is that it saves you time – you don’t have to manually compare the model outputs to sportsbooks because the Value Vault does the work for you. Just like the other probabilities, the Value Vault updates every 3 hours to include the latest lineup, starting goalie and betting line information available.
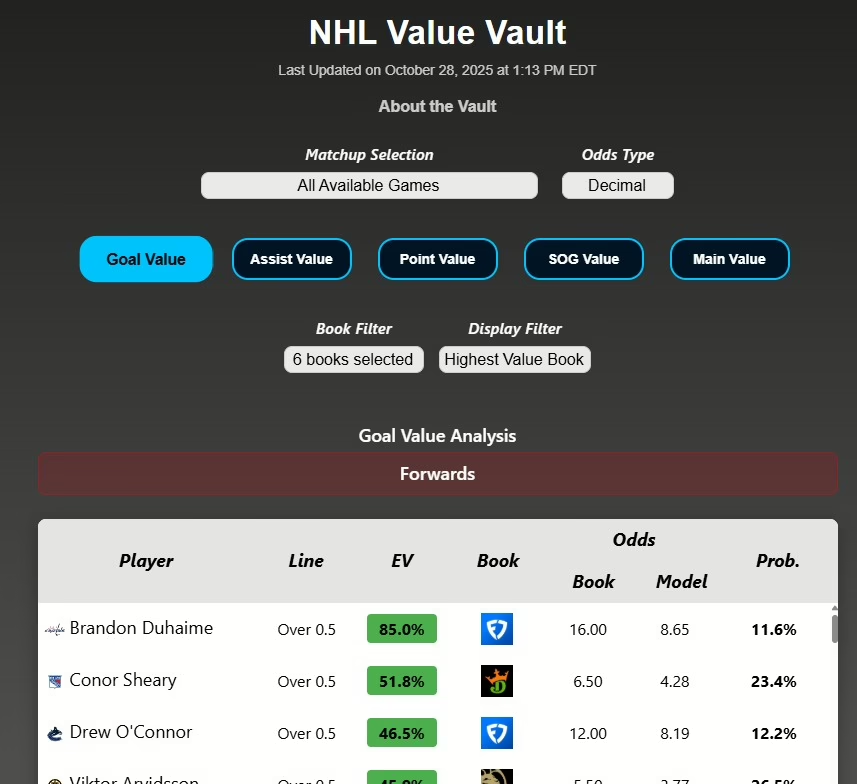
The Value Vault finds value picks in the following categories:
- Money Line
- Game Total Over/Unders
- Player SOG Over/Unders
- Player Assist Over/Unders
- Player Point Over/Unders
- Anytime Goal Scorers
You can see a detailed performance summary here: Value Vault Performance.